I build scalable data systems: SQL and Python pipelines, Power BI & Tableau dashboards, and AI-assisted decision-support tools that turn operational noise into decisions people can act on.

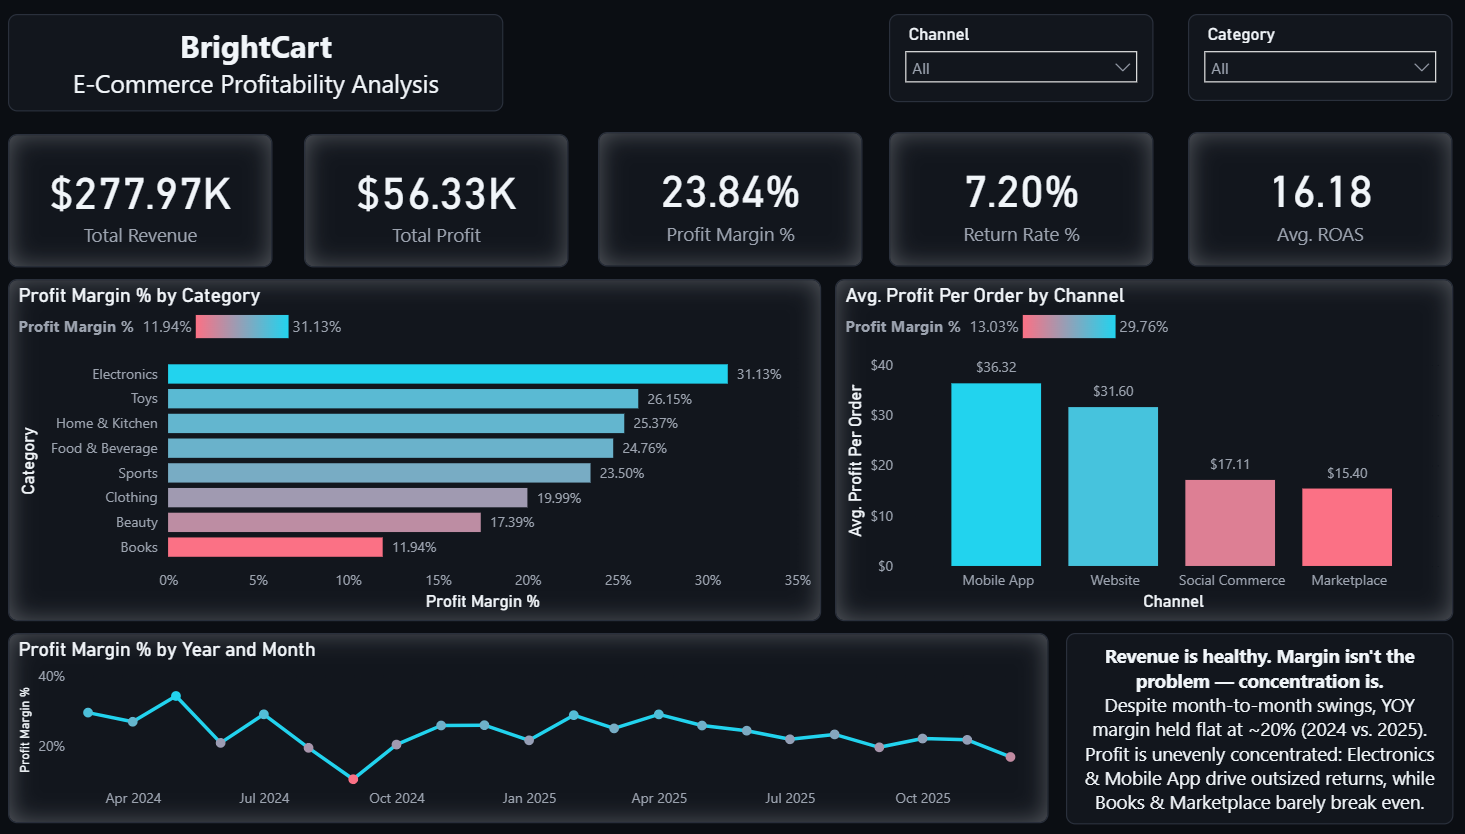
Revenue was climbing. But was profit? I validated 2,000+ orders line by line, then modeled which categories, channels, and marketing platforms were actually profitable once real costs were counted.
Monitors real daily stock price data, statistically flags abnormal price moves, and uses an LLM to explain why each one is significant.
View projectValidated and analyzed $277,969 in transaction data to reveal true category and channel profitability after fees and returns.
View projectDe-duplicated 180,519 line items into 65,752 orders to find whether fulfillment delays were regional, carrier-specific, or systemic, and what they cost.
View projectAnalyzed 4,000 members to find when churn risk peaks and built a simple 3-factor rule that flags at-risk members 4.9x above baseline.
View projectTraced port congestion back to its operational drivers across global maritime data: vessel capacity, fleet age, and region.
View projectA 3-page Power BI system tracking demand, OTIF reliability, and profitability across 10,000 orders ($111.57M revenue, 64.37% OTIF).
View projectCSU Global
Microsoft Certification (PL-300)
Certificate of Achievement, Analyst Builder (SQL, Python/Pandas, Tableau, Excel, Cloud, AI for Data Professionals)
Process improvement & operational leadership